
What is the chance of a Beast Quake?
How win probabilities are made and who they're for.

I’m fascinated by the ubiquity of win probability calculators in sporting events. ESPN’s website adds a widget to every game estimating the probability each team will win given the current conditions. Sometimes they’ll even post the win probability next to the box score on their broadcasts.
There’s clearly an infotainment allure of these time series of probabilities. Nate Silver and his ilk drive traffic to their politics website by plotting the likelihood that various candidates will win over an election season. The New York Times traumatized its readership with a real-time win probability needle in 2016 on the night Trump first won the electoral college.
It’s not clear to me who wants this sort of thing. I’d love to see the web analytics on how these probability plots drive traffic. I’m sure they have internal revenue needles there, too. You can see there must be messy incentives behind the modeling, because they only exist if someone thinks they drive revenue.
But let’s stick to sports so we can be a little less heavy on a Monday. Yesterday, in what is becoming their signature this year, the Denver Broncos managed to go scoreless for the first three quarters of the game, but somehow put up 33 points in the fourth. This was the most a team had ever scored in the fourth quarter after having been shut out, and it led to this confused win-probability trace:
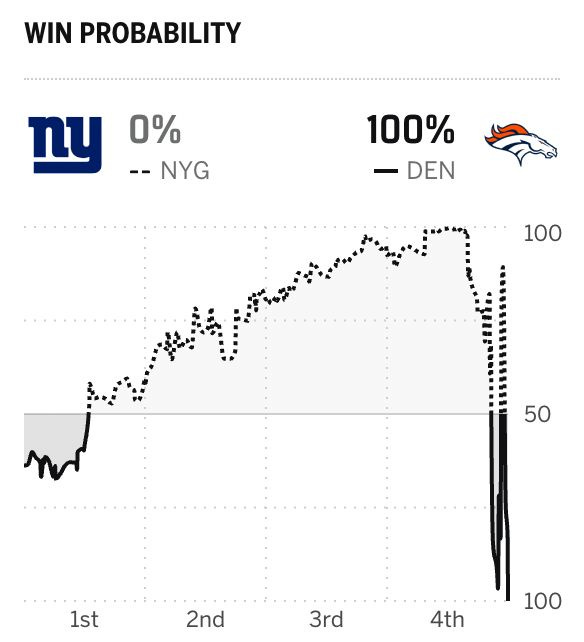
At the start of the fourth quarter, the Broncos’ win probability was 7.5%. Halfway through the quarter, their probability had bottomed out at 0.2%. They ended up winning 33-32. I’m dazzled by predictions that fluctuate between 100% and 0% over the course of a few minutes.
Where do these numbers come from? How are they made? ESPN doesn’t want to reveal their secret sauce, but Profootball Reference (PFR) has a reasonably simple model they explain on their website. It describes their first attempt at putting something together, and they probably do something slightly more sophisticated now (See if you can reverse engineer their public-facing calculator). Regardless, I think it’s good to start simple before you get into crazy weeds.
PFR’s model begins with a 1991 paper in the American Statistician, “On the Probability of Winning a Football Game.” There, Hal Stern observed that game margins are more or less normally distributed around the Vegas point spread. Every week, the illuminati gather in Vegas to set lines that determine the odds for various bets on game outcomes. The point spread is the margin at which a bet is sold at even odds. Betting the favorite to win by the point spread or more will win you a dollar for every dollar you bet.
Stern noted that Vegas wasn’t terrible at setting betting odds on average: About half of the time, underdogs beat the spread. He defines the margin of a game to be the deviation from the point spread:
margin = points_by_favorite - points_by_underdog - point_spreadHere’s a histogram of game margins from his paper
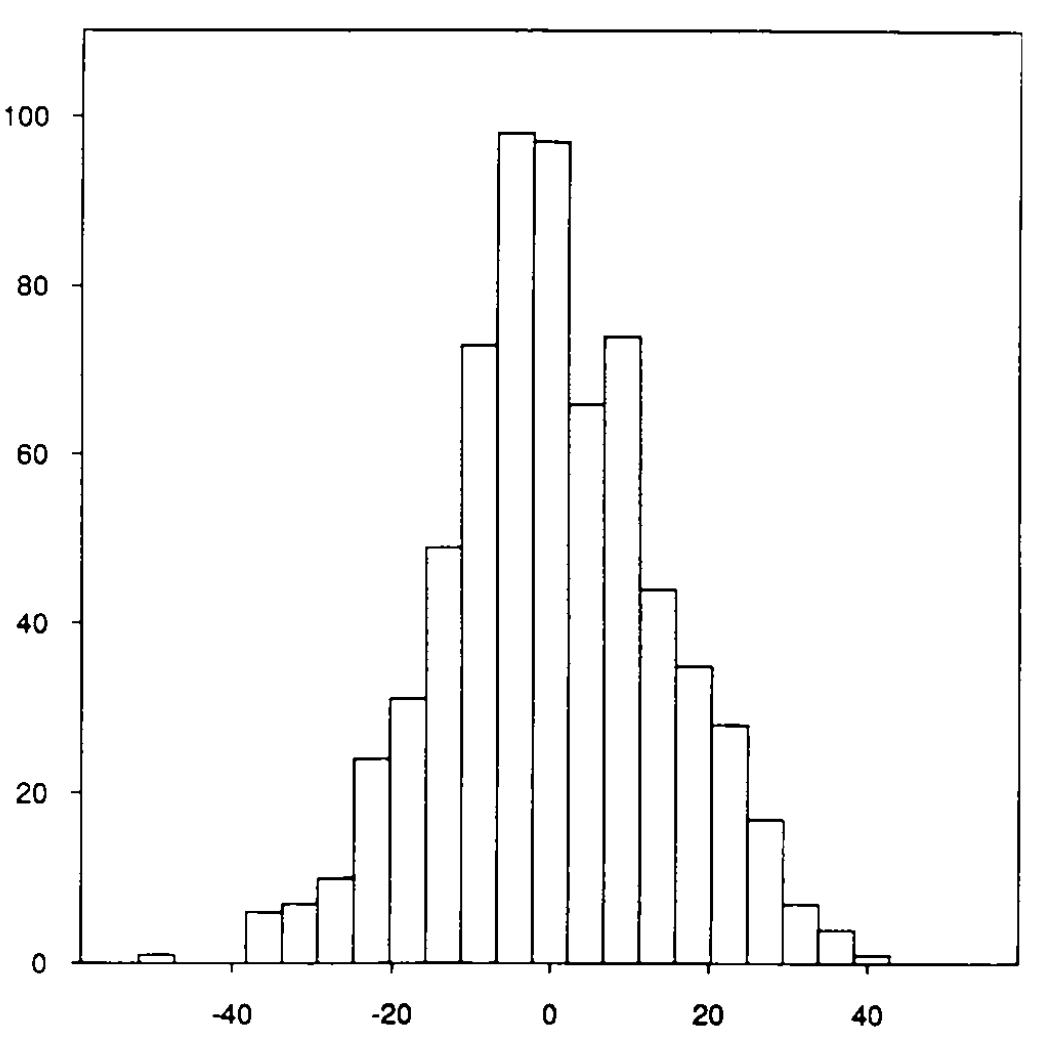
It looks pretty centered around zero, though a bit skewed towards the underdogs. Stern does a bunch of goodness of fit tests to convince himself and the rest of us that this might as well be samples from a normal distribution with mean zero and standard deviation 13.86. From there, we can get a pre-game win probability using a z-score calculator. The probability of a win is equal to the probability a normally distributed random variable exceeds the point spread divided by 13.86. The beliefs of the Vegas Sports Book combined with past variability in scoring yield us a probability of a win on any given Sunday.
Stern’s model gives us a probability for before the game begins. How do you get the exciting dynamics in a game? The simplest model assumes that the outcome remains normally distributed with a clear mean and variance that doesn’t depend on how the game has gone so far.1 The margin remains normally distributed after each play, but the mean and standard deviation are shrunk towards zero as the game progresses. PFR propose scaling the spread by the time remaining and the standard deviation by the square root of time remaining. This already gives you dynamics where each score causes a discontinuity in the win probability, adjusting the odds as the game plays out.
You can get even more fine grained by adjusting the probability based on the current down and distance. Here, PFR doesn’t go into precise formulas but says they use their expected points formulas to adjust win probabilities. I’ve seen other proposals that utilize more sophisticated machine learning or statistical models than PFR’s simple adaptation of Stern’s model. I don’t think the details matter much.
At the end of the day, these win-probability graphics are simple models driven by Vegas point spreads. The probability models are set by the bookies. They want you to have these probabilities on hand so you can make in-game prop bets. Bookies need these probability calculators to be accurate on average or else they’d go broke.
But predictability in aggregate is only good for the sports books. For the rest of us who don’t gamble, win-probabillity calculators remain a silly distraction symptomatic of the overreliance on numbers for entertainment in modern sports. We’re allowed a few exciting games a week where the probability calculators just return garbage, like in the Broncos-Giants game, because it’s funny to see machines vacilate in desperation as reality breaks their models. The irony is that sports is most fun when it’s unpredictable. No one wants to watch a rigged game.
lol independent increments.
I like the framing around, "what is the probability for?" And the answer in this case is that it is for the bookies. It kind of reminds me of the sleeping beauty problem (https://en.wikipedia.org/wiki/Sleeping_Beauty_problem), where it seems to me that the "correct" probability depends on what you plan on doing with it.
It would be interesting if a team started using analytics to determine which play would gain more fans. Give us the brain-rot sports.
Advertising "win probability" or similar metrics may have much more to do with professional sports promoting gambling rather than any sort of statistical modeling. ESPN even has its own sportsbook.